Dunedin
Hi, welcome to South of 45.A Visual Essay created by the South of 45 Team for GovHackNZ 2017

Introduction

On this website we will show you analysis to answer various questions including council influence, transport, safety, and housing These graphs and data provide insight that the council can use to address a number of different issues that face Dunedin.

Map

How affordable is heating for different parts of Dunedin?

Graph

Analysis

This graph means that for most suburbs, their ability to pay for heating is tied to their household income.
This graph shows that there are a significant number of households that struggle to heat their homes leading to negative health consequences. The hills region is an anomaly, because it reports large numbers of people unable to heat their home despite good household median income. This may reflect differences in the physical constuctions of houses in this part of Dunedin.

Map

How safe do people feel in Dunedin compared to the number of burglaries?

Graph

Analysis

There are two "Dunedins." Well off areas with low levels of burglaries whose citizens feel safe, and poorer areas have high levels of burglaries whose citizens feel less safe.

Map

How accessible is public transport in different parts of Dunedin?

Graph

Analysis

Public transport within urban Dunedin is more accessible than rural Dunedin. However, it is viewed as being less accessible in poorer areas that can less afford cars. This may be due to the increasing dependency on public transport in poorer areas.

Map

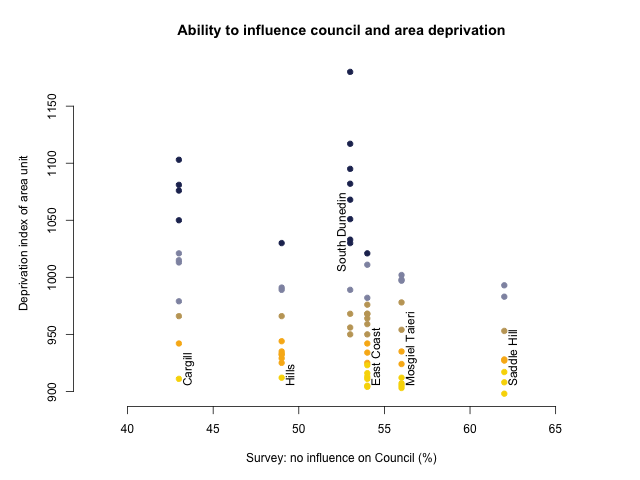
How much influence do citizens feel they have over council according to the deprevation index?

Graph

Analysis

There is a primary effect that shows that the closer you live to the University, the more influence citizens feel they have on council. We can see that the more rural areas feel that they have little influence compared to more urban areas.

There is a secondary effect that as deprivation increases, the level of influence citizens feel they have on council decisions decreases.

The Saddle Hill region is anomalous in this dataset because it feels it has much less influence than its demographics or distance expects.